

Fibonacci Support Resistance Levels
Use Fibonacci for accurate support and resistance levels and better profits from each trade. Learn how to use Fibonacci Retracement, Extension and Projection Analysis to maximize trading profits and tightly control losses. Fibonacci numbers and ratios point to specific turning points in the markets’ movements.
Fibonacci Numbers
Leonardo Fibonacci, a mathematician in the 1200’s created a numerical sequence of numbers. From left to right after the first two numbers, the values increase successively. Each number, in turn, is determined by the sum of the previous two numbers.
1, 1, 2, 3, 5, 8, 13, 21, 34, 55, 89, 144, 233, 377,…
The other interesting relationship of this number sequence is that if we take the ratio of two successive numbers in the Fibonacci series (that is, we divide each number by the number after it in the sequence) we will move towards a particular constant value. That value is 0.6180345 which has been referred to as “the golden ratio”. If you also calculate the ratios using alternate numbers in the Fibonacci series (that is, do the same calculation but skip over a number) the resulting ratios approaches 0.38196.
From here on, skipping the numbers by going in both directions we get infinitive number of Fibonacci ratios, but only handful of them have found application in modern markets:
0.236, 0.382, 0.618, 1.000, 1.618, 2.618, 4.236, 6.854, 11.090, 17.944
Many technicians use Fibonacci numbers in their Technical Analysis when trying to determine support and resistance, and commonly use 38.2%, 50%, 61.8% retracements. Commonly thought, a .382 retracement from a trend move will tend to imply a continuation of the trend. A .618 retracement implies that a trend change may be in the making. Many such rules have been adopted by technicians.
It cannot be stressed strongly enough that Fibonacci principles is not just a numbers game; it is the most important mathematical representation of natural phenomena ever discovered. To appreciate the great relevance of the Fibonacci ratio as a natural constant, one need only visit The Fibonacci Numbers and Golden section in Nature and discover a particular natural law.
Fibonacci Trading will show you that this nature phenomena has its presence in the modern market and how to understand and capitalize on it.
Fibonacci Ratios
After you have familiarized yourself with Fibonacci Numbers let’s look at the first of them:
1 2 3 5 8 13 21 34 55 89 144 233 377
There is an intriguing set of interrelationships between these numbers. For instance, any given number is approximately 1.618 times the preceding number and 0.618 time the following number and 0.382 is the inverse of 0.618. Note that these constants do not apply to the first several numbers in the sequence; however, the further along you move in the sequence, the closest the ration get to 1.618 and 0.618. Ration 1.618 is also known as the Golden Ratio or Phi.
Just as 1.618 and 0.618 describe the relationship between one numerical value and the next in the Fibonacci Sequence, so they also describe the relationship between one surge in prices and the next in the stock market. If a price surges from 5 to 8, then you can multiply the 8 x 1.618, to estimate that the next surge in price will be to 13. Likewise if the price retraces from 13 to 8, by multiplying 8 x 0.618, you can estimate that the next retracement will be to 5. We have to assume that a similar relationship will be found in price movement, whether the direction is upward or downward. Thus, an original price change to the downside would be expected to move at a rate of 1.618, and a reversal to the upside would advance at the 0.618 rate.
Continuing that logic, just as the ratios between any two successive numbers in the Fibonacci Sequence are important, so are the ratios between any three successive numbers, and any four successive numbers:
1 2 3 5 8 13 21 34 55 89 144 233 377
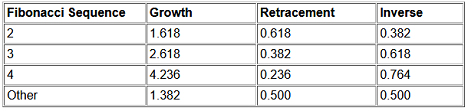
This gives us additional ratios of secondary importance (0.382 and 2.618), and tertiary importance (0.236, 0.764 and 4.236) as summarized in the table above.
The table also shows two other numbers that are important in the Fibonacci Sequence: 0.5 and 1.382. The first, 0.5 is an important retracement ratio because it is halfway between 0.382 and 0.618. The midway point is always important in any growth cycle. In the financial markets, when prices drop to the midpoint of a previous trading range, the buyers and sellers will notice this and, collectively if not consciously, pause to decide whether price levels are likely to move back up again, or to continue on down.
1st Tier Ratios
All the ratios described above we call 1st Tier Ratios because that are derived directly from the Fibonacci Sequences. They can be seen in abundance in the nature all around us and that is why their way to market trading was very well welcomed. But as more and more people learn about these ratios and try to apply them to trade stocks, mutual funds, currencies etc., their value has been diluted a little but enough for those who know 2nd Tier Ratios to gain advantage.
2nd Tier Ratios
The relationship between numbers 0.382 and 0.618 is more rich than it was just outlined. The second part of the story is that 0.618 is a square root of 0.382. Continuing this logic, if a square root of one Fibonacci ratio is a significant ratio on its own, so is a square root of another Fibonacci ratio.
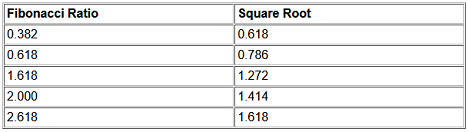
Other important ratio of 0.866 was discovered by some trader analyzing price chart patterns. It was then found that it could be derived by, again, taking the square root of a number: Square root of 0.786 is 0.886.
Some people think that 2nd Tier ratios are somewhat far-fetched, others being traders rather than mathematicians, are more intrigued by the fact that these ratios have a significance in determining support and resistance levels, as well as trend reversal price zones, than they are on the logic used in the derivation.
Correction / Retracement
Extension
Time Projection
Channel

Fibonacci Online Trading Course
TracknTrade Trading Software Using Fibonacci