

AAPL: A Room with a View of What Came . . . and What’s to Come By Elliottwave International
Apple taps highest level ever. No “fundamental” reason for the rally. But there was an Elliott wave one.
For the last two decades, I’ve adopted the same foolproof remedy for alleviating stress or sadness: namely, curl up on the couch with a bowl of salted caramel ice cream and my tattered, worn-down copy of E.M. Forster’s A Room with a View. Rereading the words on those pages, letting their wry wit and poignant insights about human nature sink in does to my spirit what spring does to a cherry tree.
Embarrassingly, my copy has more highlighted passages than a redacted CIA document. One of my all-time favorites reads: “My father says there is only one perfect view — the view of the sky straight over our heads.”
That sentiment has pulled me back from the edge of anxiety or fear about the unknown so many times I’ve lost count. It puts me here, now, in the only place I can be with.
But for traders and investors, this kind of view can be problematic. It’s the view from which “fundamental” analysis arises, which looks only at the news events straight over a market’s “head,” and ultimately projects that picture into the future, as far as the eye can see.
A recent example of this comes from the 2022 performance of the world’s largest stock by market cap, Nasdaq giant Apple Inc. (ticker symbol: AAPL). When the year ended, AAPL had plunged 25%-plus to an 18-month low, its worst annual showing since the 2008 financial crisis.
And, according to the mainstream “fundamental” view, the sky over Apple’s head was filled with heavy, value-eroding clouds such as: increased competition from overseas, a looming economic recession in the U.S., shipment delays, logistic bottlenecks, outdated innovation, and so on.
Here, these headlines from the time set the scene:
- “Apple Stock: A Troublesome Tryst with Tech’s” (Dec. 18, 2022 Seeking Alpha)
- “Down 30%. Apple Stock is Still Risky” (Jan. 4, 2023 Motley Fool)
- “Apple Stock: You’ve Been Warned” (Jan. 4 Seeking Alpha)
On January 4, Bloomberg wrote:
“Apple’s Stock Is Losing Its Shine After an Ugly Month of December.
“Until recently, shares of the world’s most valuable company defied much of the gloom that walloped other tech giants in 2022… With its valuation still above its average over the past decade, there’s plenty of room to fall.”
This is “fundamental” market analysis at its core. It’s a one-directional relationship with markets which disables investors from seeing beyond current price action.
And instead of having “plenty of room to fall,” AAPL ran out of downside runway. In early January 2023, AAPL turned itself around, soaring to its highest level ever in June. On June 29, Reuters observed the stock’s disassociation with its bearish forces:
“There hasn’t really been any new information fundamentally that would be supportive of the stock move… What you’re left with is, you know, the market itself.”
We couldn’t agree more, because while there wasn’t “fundamental” information to support Apple’s 2023 comeback, there was plenty of Elliott wave information to do so.
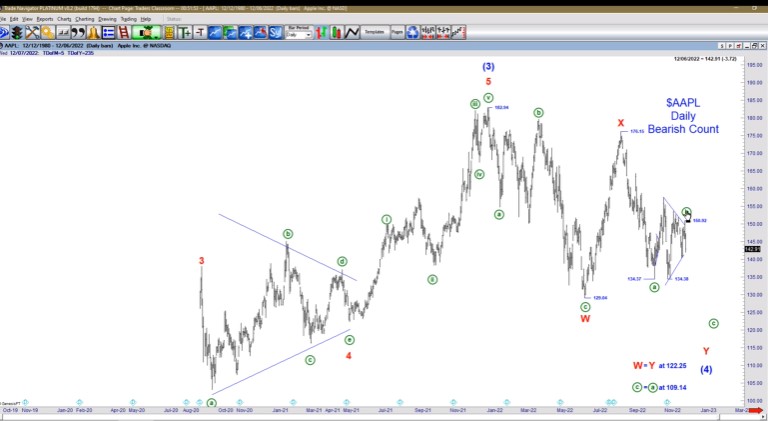
Here, on December 7, 2022 our Trader’s Classroom presented a 360-degree view of Apple that incorporated its past, present, and future. First, Trader’s Classroom outlined a broad, bearish trajectory for AAPL that would take prices down into a specific price window of 109.14-122.25 to complete a wave (4) correction.
This move would prep the way for a bullish takeoff. From Trader’s Classroom:
“If Apple does indeed break down as this count calls for, we can probably expect a bottom somewhere within this range. That gives us an area to look for.”
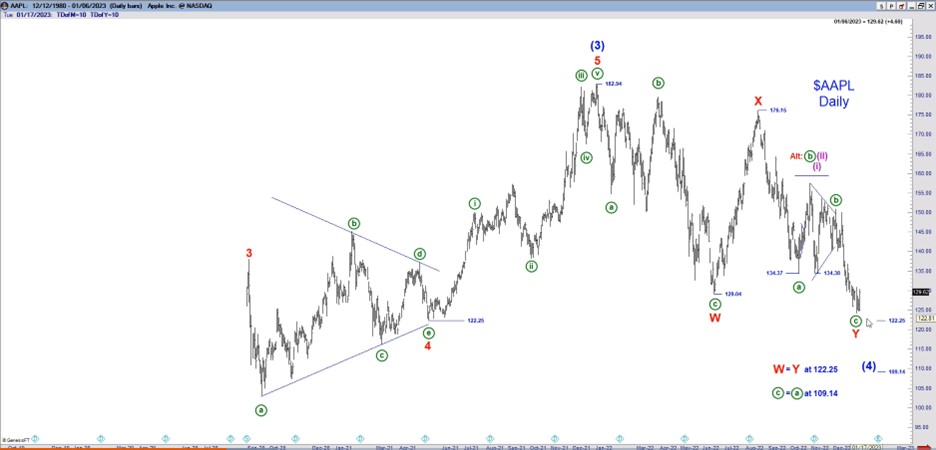
From there, AAPL indeed closed out December in a powerful downtrend, landing into a low on January 4, which likely completed the bearish leg of the Elliott wave pattern.
Then, on January 9, Trader’s Classroom revisited AAPL with an updated wave count. There, editor Robert Kelley called for further decline in wave (4). However, he also presented key and critical price levels to watch that, if breached, would signal the alternate, bullish count was in play. From Trader’s Classroom:
“When I’m in a trade, I’m always asking where I am potentially wrong. What other counts could be in play that would be counter to what I’m expecting. And where would that alternate count gain significant credibility to where I want to alter my position.
“The level I would no longer be confident of further decline in Apple is if it goes above 140.70. [That would suggest] the bullish alternate is probably the case and Apple is ready to take off.”
AAPL did continue higher, pushing through Robert’s resistance level to confirm the trend had turned up. The stock continued to rally, reaching an 8-month high in mid-April. Then on April 4, Trader’s Classroom confirmed the stock’s uptrends was still intact and said:
“I would be bullish on Apple while the 161.51 level holds. If this count is right, it’s going to keep going up. One thing I’ve learned is when a market is going your way, that’s not the time to call the preferred count that’s working into question. You still want to go with it, and that’s what I’d like to do here.”
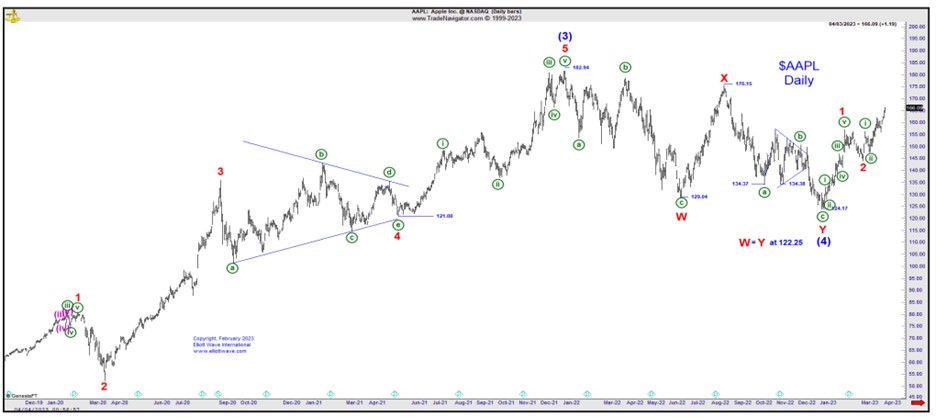
And from there, AAPL continued to push higher, soaring to record highs in June.
In the words of E.M. Forster from A Room with a View: “Choose a place where you won’t do much harm and stand it in for all you are worth.”
For traders and investors, such a place is the goal. And for you, getting to that place might mean taking a very different view than the mainstream experts — the independent view of Elliott wave analysis.
Of course, trading markets carries risk and not all Elliott wave interpretations of price action turn out to be correct. But no model of forecasting offers a more comprehensive view of high-probability, near-, and long-term trend changes in store for the world’s leading ticker symbols.
In fact, on June 13, Trader’s Classroom presents an updated wave count for Apple (along with Costco, Caterpillar, Amazon, crude oil, Tesla, and more). There, Robert Kelley offers a range of options for safely riding the trend, and not having a winner turn into a loser.
Trading Lessons (Plus, Market Opportunities): 2 for 1
3 times a week, press “Play” and watch instructor Robert Kelley explain in comprehensive detail how to recognize the relevant Elliott wave patterns (and supporting technical indicators) underway now and in the future.
This is every Trader’s Classroom video in a nutshell: a lesson, often with a new opportunity subscribers are free to act upon (or just absorb the lesson for future use). Not to mention a boatload of subscriber extras including educational videos and webinars.
