

How Trend Channels Can Help You Navigate Financial Markets By Elliottwave International
The price of this commodity craters after hitting top line of trend channel.
Let’s start with a quote from Frost & Prechter’s Wall Street classic, Elliott Wave Principle: Key to Market Behavior:
R.N. Elliott noted that a parallel trend channel typically marks the upper and lower boundaries of an impulse wave, often with dramatic precision. You should draw one as early as possible to assist in determining wave targets and provide clues to the future development of trends. emphasis added
With the above quote in mind, here’s how a trend channel played a role in an analysis of lumber (trend channels can also be applied to the price charts of other financial markets).
This is a chart and commentary from our June 2021 Elliott Wave Financial Forecast:
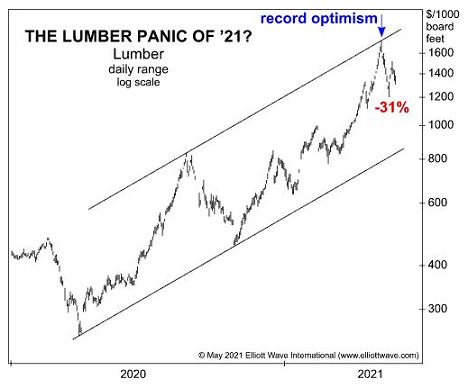
The chart of lumber prices shows that since April 2020, lumber surged 589%. As the headline on the chart suggests, however, the final run-up looks suspiciously like a buying panic. Notice that prices peaked the exact day they met the top line of the trendchannel formed by the rally from 2020.
By the way, when lumber’s price hit that top line, many investors were highly bullish. Indeed, the 5-day DSI indicator (trade-futures.com) was at 96%. That was a record high going back 34 years. In other words, only 4% believed lumber was on the verge of decline. Such lopsided sentiment is often an indicator in and of itself.
This April 27, 2021 Yahoo! Finance headline gives you an idea of the then expectations for lumber prices:
Lumber prices are up 232% and ‘could spiral out of control in the next few months’
That headline published within a week of lumber’s high.
Yes, lumber did “spiral out of control,” so to speak, but it was on the downside.
Indeed, let’s look at what happened with lumber’s price between the publication of the June 2021 Elliott Wave Financial Forecast and around the end of 2022. This updated chart and commentary are from the January 2023 Elliott Wave Financial Forecast:
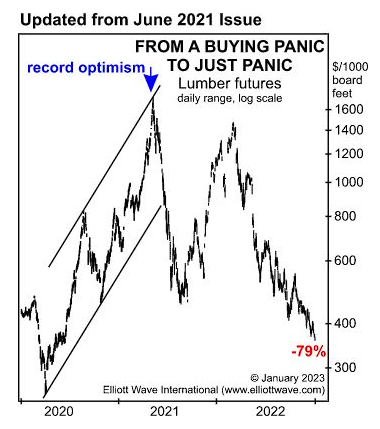
The rush to get into new homes reminds us of this chart of lumber prices, which EWFF first showed in June 2021. Noting that lumber prices peaked on the “exact day” of meeting the top line of the trend channel, EWFF stated, “The final run-up looks suspiciously like a buying panic.” Turns out, that’s exactly what it was. The decline since then brought lumber futures prices down 79% into December 20.
As you might imagine, not every forecast is guaranteed to work out perfectly, however, Elliott wave trend channels have proven to be highly useful.
You’ll frequently find discussions of trend channels — as well as an array of indicators — as they relate to key financial markets in our monthly Elliott Wave Financial Forecast, monthly Elliott Wave Theorist and thrice weekly U.S. Short Term Update.
Of course, detailed Elliott wave analysis is the backbone of our financial markets’ forecasts.
Look for yourself — as you follow the link below.
Financial Markets Are Filled with Fibonacci Relationships
The Fibonacci sequence of numbers and the ratios between those numbers provide the mathematical foundation of the Wave Principle.
As Frost & Prechter’s Elliott Wave Principle: Key to Market Behavior states:
Ratio analysis is the assessment of the proportionate relationship, in time and amplitude, of one wave to another.
The Financial Forecast Service (comprised of the monthly Elliott Wave Theorist, monthly Elliott Wave Financial Forecast and the three-times-a-week U.S. Short Term Update) regularly uses ratio analysis to help determine what’s next for major financial markets. These markets include stocks, gold, silver, the U.S. dollar and more.
Learn the current Fibonacci ratios in the charts of major U.S. financial markets — and what they mean — by going here.