

Japanese Candlesticks by Elliott Wave International
EWI senior analyst Jeffrey Kennedy shows you how to identify quality trade setups with supporting technical indicators. By Elliott Wave International
“I always will be an Elliottician, but other technical tools have merit and are indeed worthwhile: they allow me to build a case, build a more confident reason for making a forecast and for taking a trade; making a trading decision.” – Jeffrey Kennedy
I recently asked Elliott Wave International analyst Jeffrey Kennedy to name his 3 favorite technical tools (besides the Wave Principle). He told me that Japanese candlesticks, RSI, and MACD Indicators are currently his top methods to support trade setups.
In this 3-part series, we will share examples of how to use these 3 tools to “build a case” in the markets you trade. These practical lessons allow you to preview how Jeffrey applies techniques with proven reliability to support his analysis.
We begin this first lesson with a basic candlestick-style price chart.
You may be familiar with an Open-High-Low-Close (OHLC) chart: comprised of vertical lines with small horizontal lines on each side. The top of each vertical line is the high and the bottom is the low. The small horizontal lines on either side represent the open and close for that period.
Here’s an example of a Japanese Candlestick chart:
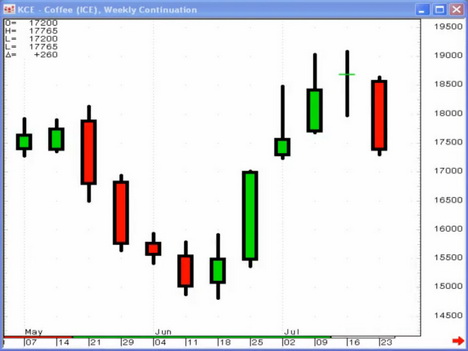
Japanese candlestick charts employ the same data that OHLC price charts do except that the data is expressed differently. The real body is the range between the open and close, and appears as a small block. Shadows are the lines that extend upward and downward from this block, and represent the highs and lows.
Next, take a look at the chart below.
Two bearish candlestick reversal patterns that Jeffrey finds highly reliable are the Evening Star and the Bearish Engulfing Patterns. This weekly continuation chart for the Canadian Dollar combines a 20-period moving average to show that the trend is down — allowing you to focus on bearish reversal candlestick patterns to spot trading opportunities.
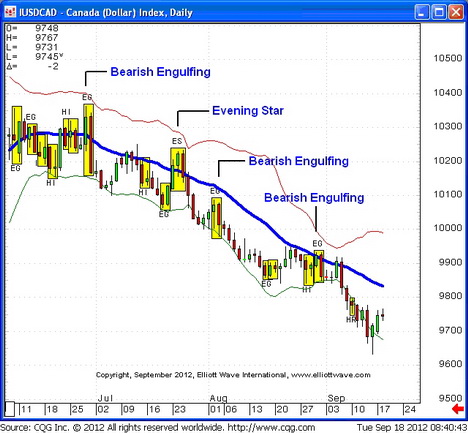
Jeffrey notes that “combining these reversal patterns with moving averages makes them even more dynamic because they focus your attention in the direction of the larger trend.”
Japanese Candlesticks begin our spotlight on Kennedy’s top 3 ancillary tools for trading with the Wave Principle. We’ll share parts two and three via how Kennedy uses RSI and MACD indicators to support his Elliott wave interpretation in coming weeks.
Relative Strength Index (RSI)
“There are many different forms of technical analysis. A completed Elliott wave pattern supported by additional evidence allows for more confident forecasts and higher probability trades.” – Jeffrey Kennedy
Trader and technical analyst Jeffrey Kennedy has more than 25 years of experience using with the Elliott Wave Principle. To support his Elliott wave analysis, Jeffrey says that his 3 favorite technical tools are Relative Strength Index (RSI), MACD, and Japanese candlesticks.
Buying pullbacks in uptrends and selling bounces in downtrends are great ways to trade trending markets.
Developed by J. Welles Wilder, Jr. and presented in his 1978 book, “New Concepts in Technical Trading Systems,” RSI measures the strength of a trading vehicle by monitoring changes in closing prices and is considered a leading or coincident indicator. Andrew Cardwell popularized RSI as a trading tool by introducing the concept of range rules.
The theory behind range rules is that countertrend price action in trending markets has specific momentum signatures. RSI, for example will find support within roughly the 50-40 region when pullbacks in uptrends occur. Conversely, when bounces develop in downtrends, RSI will meet resistance in the 50-60 area.
Taking the path of least resistance is a benefit of trading in the direction of the trend. Moreover, the use of RSI and application of Andrew Cardwell’s range rules help identify when a trader can rejoin the trend.
MACD Moving Average Convergence Divergence
“Guessing or going by gut instinct won’t work over the long run. If you don’t have a defined trading methodology, then you don’t have a way to know what constitutes a buy or sell signal. Moreover, you can’t even consistently correctly identify the trend.” – Jeffrey Kennedy
Jeffrey Kennedy is an accomplished teacher and a Senior Analyst here at EWI. Yet he often says that the Wave Principle alone is not a trading methodology. It does not tell you how much trading capital you can afford to risk, or specific guidance about which entry or exit levels are best suited for your trading style or where to set your protective stop.
Kennedy also says that along with risk management and emotional discipline, the right technical tools are a vitally important part of supporting your wave count.
To enhance trading confidence, Jeffrey’s 3 favorite technical tools are Japanese candlesticks, RSI, and MACD. Today’s lesson shows you how MACD can help identify trading opportunities with an example from USDCAD.
Moving average convergence divergence (MACD) is a momentum indicator developed by Gerald Appel. It consists of two exponential moving averages, the MACD line and Signal line. The difference between these two lines yields an additional indicator, MACD Histogram.
Since these studies evaluate momentum, they work optimally in trending markets. When combined with reversal candlestick patterns, MACD and MACD Histogram can increase confidence in these patterns as well as continuation of the larger trend.
MACD divergence occurs when prices move one way and MACD moves the other. Bearish divergence forms when prices make new highs and MACD does not. Conversely, new price lows without lower MACD readings is bullish divergence. These conditions aid traders in identifying potential changes in momentum and trend.
MACD is constructed using two lines referred to as the MACD line and the Signal line.
When the MACD line appears to penetrate the Signal line, but fails to do so, a hook forms. The significance of a hook is that it coincides with countertrend price moves.
MACD is excellent technical tool provided you know how to use it and what to look for.
Expert Market Forecasting Using the Elliott Wave Principle

Real-Time Elliott Wave Trading Online Streaming Course
TracknTrade Elliott Wave Trading Software