

What Is Bitcoin’s Low Volatility Telling You? By Elliottwave International

November 12 PRX Crypto System Streaming Workshop
Bitcoin has been trading in a relatively narrow trading range for the past couple of months — mainly $19,000-$20,000 — quite in contrast to the cryptocurrency’s wild price swings of the past few years.
Indeed, an Oct. 30 CNBC news item noted:
Bitcoin’s 20-day rolling volatility fell below that of the Nasdaq and S&P 500 indexes for the first time since 2020… being stuck in such a range does make it boring, but this is also when retail loses interest and smart money starts to accumulate,” said a crypto exchange executive.
Of course, that implies the “smart money” believes Bitcoin will eventually breakout to the upside.
At least one observer of Bitcoin — the chairman of financial services firm Sanders Morris Harris — recently said (Reuters, Oct. 26):
“If bitcoin rallies above 21,000, I would be a buyer of it,” adding that if a “psychological zest” is rekindled, then [it] could be “quite rewarding.”
Of course, only time will tell if that works out.
At least one thing that was said, however, certainly dovetails with the Wave Principle — and that is, “psychological zest” is the main factor which drives financial markets higher — just like psychological pessimism drives markets lower.
The Wave Principle reflects the repetitive patterns of investor optimism and pessimism, and a deep knowledge of these patterns has helped Tony Carrion, our senior cryptocurrency analyst, make some noteworthy Bitcoin calls.
For example, let’s go back to the early days of 2021, when pessimism toward Bitcoin was pronounced.
Indeed, a Jan. 27, 2021 Forbes headline asked:
Bitcoin Has Crashed. Is This The End?
That was in response to Bitcoin’s swift slide from near $42,000 to around $30,000.
Yet, Bitcoin’s Elliott wave pattern suggested that the price would rebound.
Here’s a chart and commentary from our Feb. 5, 2021 Global Market Perspective, a monthly publication which covers 50-plus worldwide markets:
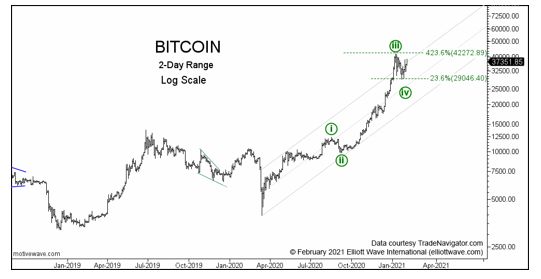
Our preferred [Elliott wave] count is that [Bitcoin] is advancing within the subwaves of a [larger up wave]… The wave IV (circle green) correction played out for most of January. Wave evidence suggests that the correction ended on Jan. 22, [2021].
The cryptocurrency went on to climb to as high as near $58,000 on Feb. 22, 2021. But, then, another heart-pounding drop followed. The price had dropped around $12,000 in just a matter of days.
But, yet again, the digital currency bounced back and eventually hit a then all-time high on April 14, 2021 of more than $64,000.
Of course, a lot of volatile price action unfolded thereafter, yet the idea is to give you a past example of our Elliott wave analysis of Bitcoin.
Do understand that no analytical method can offer a guarantee, yet the Elliott wave model is the most useful analytical method of which Elliott Wave International knows.
Learn what Elliott wave analysis is suggesting is next for Bitcoin (and other cryptocurrencies) by following the link below.
Price Pattern Analysis Vs. Most Market Opinions
Most market opinions are based on events outside the market — “causality.” In other words, many pundits believe that the news or “fundamentals” drive global financial markets.
But Elliott Wave International has compiled a mile-high stack of evidence that proves this is simply incorrect.
On the other hand, we have observed that the price patterns of major global financial markets do repeat at all degrees of trend — and this repetition offers predictive value.
Want to get your hands on our Elliott wave experts’ predictions of 50-plus worldwide financial markets — including global stock indexes, cryptocurrencies, bonds, metals, forex, crude oil — and much more?
Go To Pro-Services Here To Find Out More