

Deere Thor Industries Lead Five Stocks Near Buy Points Riding Strong Trends By Investors Business Daily
DE stock, Ruth’s Hospitality Group (RUTH) and MarineMax (HZO) lead this weekend’s menu of stocks to watch near buy points as the sizzling economy lifts almost all boats. While Ruth’s benefits from the fading of the Covid threat, the pandemic’s lifestyle boost for outdoor living and personal transportation continues to propel HZO stock and RV maker Thor Industries (THO). The booming farm economy is powering Deere (DE), while record highs on Wall Street and a big investment-banking crop buoy Jefferies Financial Group (JEF).
Deere, MarineMax and RUTH stock are now in buy zones, while Thor and Jefferies Financial stock are just below breakouts.
Deere, HZO stock and Jefferies Financial are all members of the elite IBD 50 list. DE stock also is part of IBD’s SwingTrader portfolio focused on applying the rules of IBD’s CAN SLIM investing system to take advantage of short-term stock market trends.
DE Stock
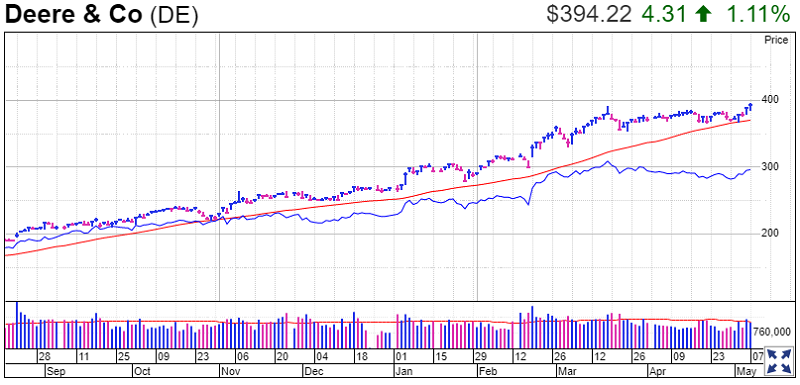
Deere stock blasted higher on Feb. 19, when the Moline, Ill., company mowed down EPS estimates, beating by 79%. At the time, Deere raised its outlook for full-year net income by $1 billion to a range of $4.6-$5 billion.
Since then, the outlook for the farm economy has only grown brighter, with prices for corn and soybeans recently hitting eight-year highs.
Nitrogen fertilizer maker CF Industries, the IBD Stock Of The Day on May 6, said the good times look likely to last through 2022 and beyond. ” Low crop inventories “will require more than one growing season to be replenished,” CF said in its earnings report.
Analysts expect Deere earnings to jump 112% to $4.47 a share on 28% higher sales of $10.5 billion when Deere reports Q2 results on May 21. Investors will be keen to hear how Deere is managing through the global chip shortage and other supply-chain issues.
DE stock rose 1.1% on Friday to 394.22. That’s 2% above an oddly shaped, shallow cup-with-handle with a 386.16 buy point seen on a weekly MarketSmith chart, putting it still within a buy range that runs to 405.47.
Deere stock’s daily chart shows a 392.52 buy point, ignoring the handle since it has a flat base. That provides a little more headroom.
Volume was only average for Deere stock on Friday, when it cleared the flat base entry. But it was above average on Thursday, when it cleared the 386.16 entry.
The relative strength line for DE stock, the blue line in the chart provided, is still slightly below the February peak, but that follows a long uptrend. A rising RS line signals a stock is outperforming the S&P 500 index.
RUTH Stock
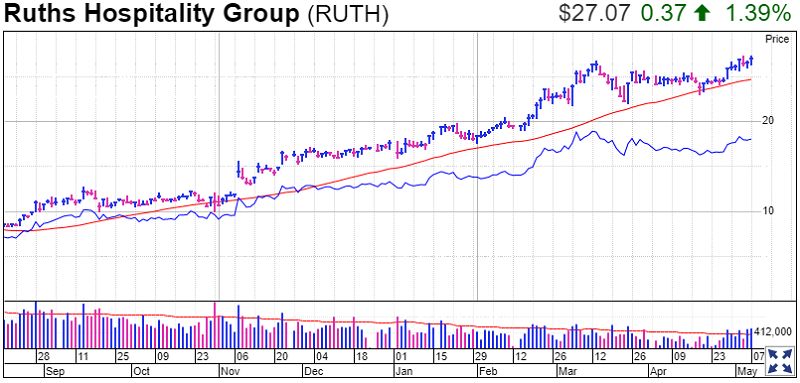
RUTH stock rose back into a buy zone on Friday after reporting Q1 EPS of 26 cents vs. 9 cents a year ago, more than doubling analyst estimates.
The operator of Ruth’s Chris Steak Houses highlighted the improving sales trend. Company-owned restaurants, which account for just over 50% of more than 140, saw April sales rise 2.7% vs. 2019 levels, which cratered a year ago amid the lockdown. An easing of Covid restrictions in New York, Boston and Hawaii should help results going forward.
Ruth’s also said it will accelerate expansion plans, opening eight restaurants by the end of 2022, including six company-owned.
Management also noted that Covid-inspired productivity steps, such as ordering with QR codes on mobile phones, should have a lasting benefit for margins.
RUTH stock rose 1.4% to 27.07 on Friday, closing just above a 26.97 buy point from a seven-week consolidation. For the week, shares rose 3.7% in above-average volume, following a 6.7% jump in the prior week.
HZO Stock
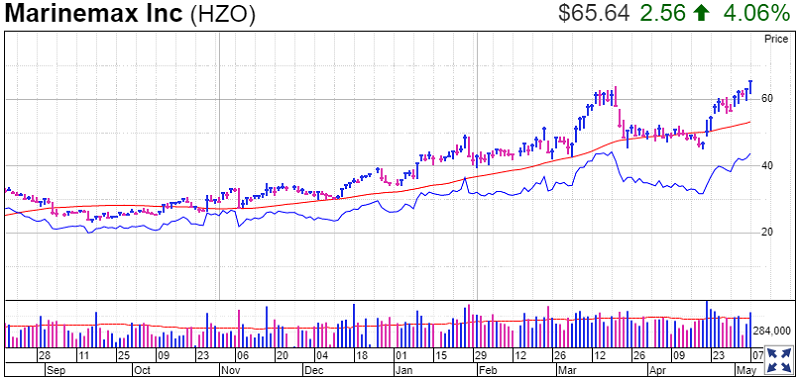
MarineMax, the IBD Stock Of The Day on May 3, broke out of a six-week cup base on Friday. HZO stock rose 4.1% to 65.64 on above-average volume, clearing a 64.09 buy point. The buy zone runs through 67.29.
While HZO stock ran up quickly from the bottom, raising the risk of a post-breakout pullback, there are two positives. One, MarineMax did have a couple of pauses along the way, though nothing like a true handle. Also, volume was strong on much of the run up, unlike many recent cup bases where the stock rallies toward highs on light trade.
MarineMax has a best-possible 99 IBD Composite Rating. The Composite Rating combines several key fundamental and technical factors into a single score. IBD research shows that all-time stock winners often have a Composite Rating of at least 95 near the start of big runs.
On April 22, MarineMax blew past analyst estimates with 70% sales growth as EPS vaulted to $1.69 vs. 23 cents a year earlier. The boat and yacht retailer also hiked its full-year EPS outlook to a range of $5.50-$5.65 vs. estimates of $4.35.
The company topped that news off with its May 3 announced acquisition of Cruisers Yachts for $63 million, saying the deal should add to earnings in the first year.
MarineMax’s scale and manufacturing relationships are seen as a key advantage at a time when inventories are sparse and boat builders are facing parts shortages.
THO Stock
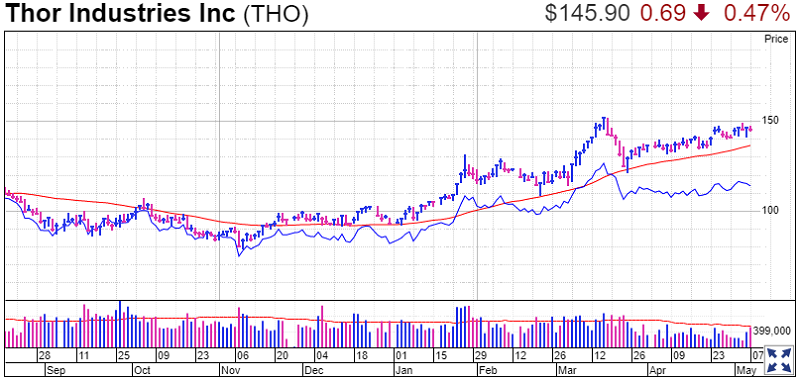
Thor Industries stock dipped 0.5% to 145.90 on Friday, closing less than 2% below a 148.18 buy point from a cup-with-handle base.
THO stock has been building a base since it peaked at 152.20 on March 18, after surging on results from its January fiscal Q2 reported on March 9.
Thor said its 68% quarterly sales increase was driven by a 47% rise in unit shipments and a 21% increase in prices. The latter partly reflected the addition of higher-priced Tiffin Group product lines following its December 2020 acquisition.
On April 14, competitor LCI Industries pre-announced sales for its March first quarter of $1 billion vs. estimates of $880 million, showing continued strong demand in the sector.
Thor Industries said in March that demand is outrunning supply and that 2022 will be a restocking year for dealers, providing a sales tailwind.
Rival Winnebago Industries (WGO) is just below a 84.72 handle buy point.
JEF Stock
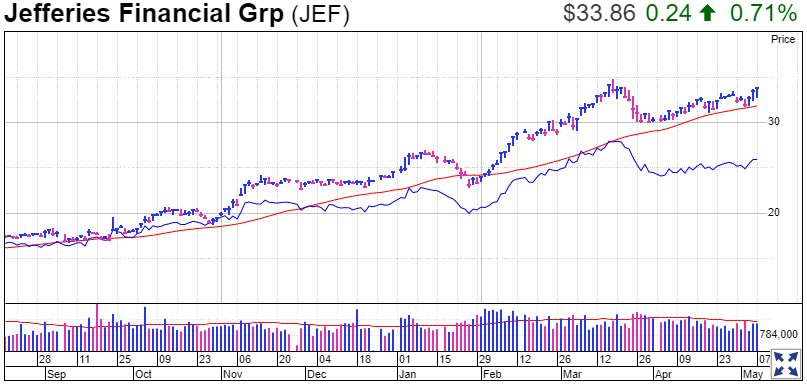
Jefferies Financial Group rose 0.7% to 33.86 on Friday, closing about 3% below a buy point from a seven-week cup base.
Jefferies reported its all-time record quarterly earnings for the February fiscal first quarter on March 24. Revenue surged 79% to $2.49 billion amid strong growth in investment banking and asset management revenue.
Jefferies is ranked No. 3 in the Finance-Investment Bank/Brokers industry group, which is now ranked 36 out of 197 industry groups tracked by IBD. JEF stock has a 98 IBD Composite Rating. Still, Jefferies has minimal coverage by analysts and management argued in a January shareholder letter that its strengths are underappreciated by investors.
In the January letter, the company said 2020 revenue was 110% of its 2015 level, while costs were just 70%. The company wrote that it had cut outstanding shares to 274 million from 373 million over three years, taking advantage of a “once-in-a-lifetime opportunity.”


Investing Trading 1-to-1 Coaching
Trading Education Online Courses