

An Overheated Market. Bears Turning Bullish. What Next? By Van Tharp Trading Institute
Should I stay or should I go now?
If I go there will be trouble
And if I stay it will be double
So you gotta let me know
Should I stay or should I go?
–Mick Jones, Joe Strummer, et al
Do you ever get such a feeling of indecision in the markets? You know the one I’m talking about (and feeling right now)—the one that is so amazingly summed up by British punk rock band The Clash in their classic song quoted above. (Please read below the signature line of this article to see my favorite summation of this all-time classic).
On Friday of last week (June 9th), the S&P 500 had a close 20% above its October 13, 2022, low, technically ushering in a new bull market. Barron’s featured a shiny bull on its cover with the headline, “Don’t Fear the Bull Market. Why Stocks Are Headed Higher.”
By Saturday evening, my good friend had sent me the cover and reminded me of the “Magazine Cover Indicator” research that we had analyzed time and again. And this morning, one of the most bearish fund managers I know had pivoted, looking to start buying pullbacks in July…
Last week, in this same space, I showed a chart of VIX, or volatility index, making a new multi-year low. And it has stayed near that 3+ year low since then:
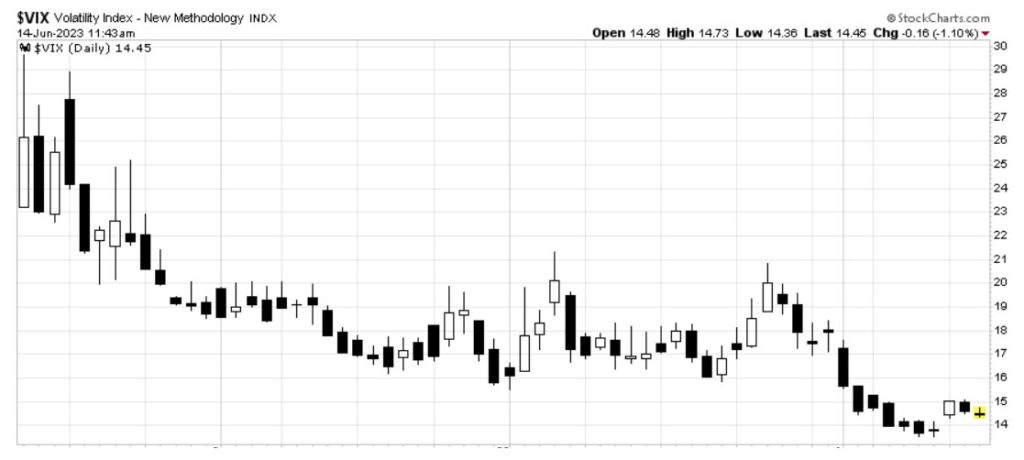
I even added some positive commentary last week:
“Of course, there’s still the concern for this being a weak seasonal period (Sell in May and Go Away) that along with other factors could turn this breakout into a “bull trap”. But the VIX drop is adding to the indicators showing a more impressive foundation for unexpectedly consistent market strength.”
But now the contrarian in me has me thinking about that stinkin’ song by The Clash again…
Should I Stay or Should I Go?
Some perma-bears are turning bullish. The Magazine Cover Indicator is also showing contrarian overbought signals. On the other hand, the VIX index is indicating a market that’s not pricing in any big moves in the next 30 days, despite a U.S. Fed (central bank) announcement coming out this afternoon (it will have likely come out by the time you read this).
Toss in a very interesting chart from Goldman Sachs research that says markets often respond favorably for 12 months after market breadth narrows. And that is exactly what is happening now with the “Big Seven” market capitalization companies (APPL, MSFT, GOOGL, AMZN, NVDA, META, and TSLA) making up almost 30% of the S&P 500. Here’s the Goldman Sachs chart:
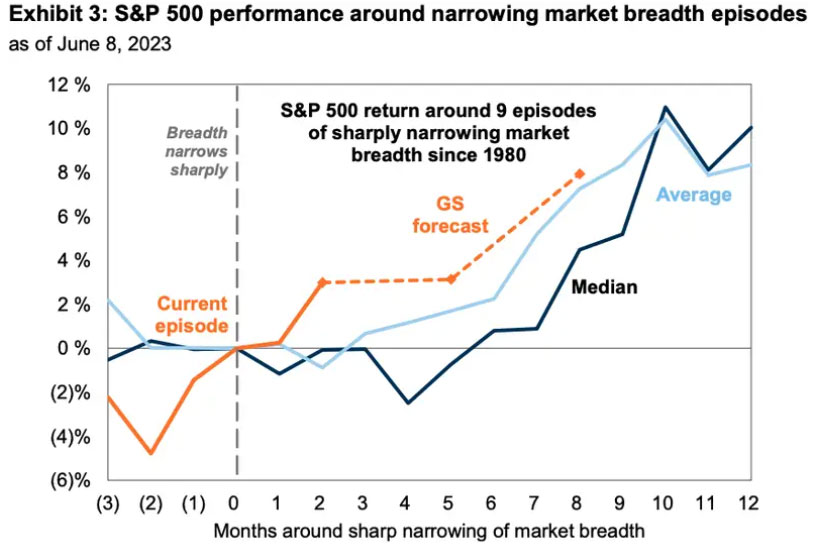
The Goldman data shows that, on average, the last nine times that a small number of huge companies have led the markets higher have been resolved by the market moving higher still, as lower-tier companies played catch-up.
There seem to be strong arguments on market direction for both the bullish and bearish cases. Should I stay or should I go, indeed.

Van Tharp Trading Institute Live Online Workshops Books Home Study Courses Free Resources Blog