

Tesla Traders: Stay Decisive Even as the Stock Gets More Divisive By Elliottwave International
Tesla forecasts are all over the mainstream map. Our advice? Use a different map, like, say, one with Elliott wave patterns.
Tesla Motors, the famous EV carmaker, is known for catching more heat than a roman candle. Twitter-addicted CEO Elon Musk has been called,

Tesla’s tendency to favor shareholders over profits has been called one of the most “unsustainable business models” of our time.
And now, Tesla’s Nasdaq-listed stock (TSLA) has been called one of “the market’s most divisive” of our time. (April 27, 2021 Barron’s)
In fact, the mainstream debate over TSLA’s future is more polarizing than the neodymium magnets used to power Electric Vehicles. On any given day of the week you’ll find equally passionate experts on each side of the debate. It amounts to a picture of conflict regarding where the mainstream believes Tesla’s stock is headed:
Bearish: “Tesla: A Consensus Estimates are Much Too High Indicating Downside for the Stock” (July 13 Seeking Alpha)
Bullish: “Piper Sandler analysts ‘still really like’ Tesla’s stock, think shares can pop nearly 70%” (Aug. 3 CNBC)
Bearish: “Tesla’s Q2 Results Were Solid, But We Still Think the Stock is Overvalued.” (July 28 Forbes)
Bullish: “Top Wall Street Analysts Are Betting on More Gains for Tesla” (August 1 CNBC)
The reason for this whiplashing inconsistency is simple: Mainstream analysts use fundamentals to shape their market predictions. In other words, they look to events and data outside a market like earnings, product innovations, demand trends and so on to gauge whether its future is bullish or bearish.
But Tesla will prove what’s always true of virtually all companies: there is NO correlation between positive fundamentals and positive growth (or vice-versa).
Reads one October 12, 2020 Business Insider:
“Tesla’s 425% surge this year ignores fundamentals more than any other stock rally in history… We’ve never seen a stock rise that much that fast with such little regard for past fundamentals.”
Ergo, the question remains: If not fundamentals, what does drive price trends?
The answer is investor psychology, which in turn unfolds in observable Elliott wave patterns on a company’s price chart. Fundamental-based analysis of Tesla’s stock may have been all over the map, yet Elliott wave analysis of TSLA has been right on target since its transition from a months-long consolidation to a powerful uptrend in late 2020.
Here, in our November 17 Trader’s Classroom, editor Jeffrey Kennedy identified a clear Elliott wave pattern underway in Tesla — a triangle. As pictured, triangles are 5-wave, sideways patterns that always precede the final move of a larger pattern. Thus they signal an approaching change of the existing trend.
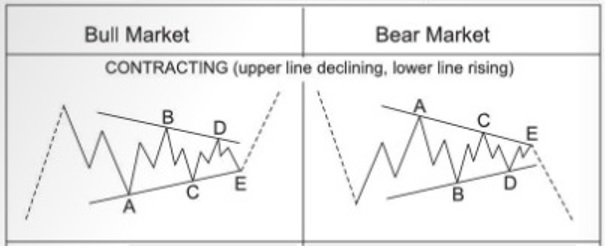
In the November 17 Trader’s Classroom, Jeffrey labeled the three-month long sideways movement in TSLA since August as a “textbook quality barrier triangle” and said:
“Moving forward, I think we can continue to look up. We’re looking higher in wave 5.”
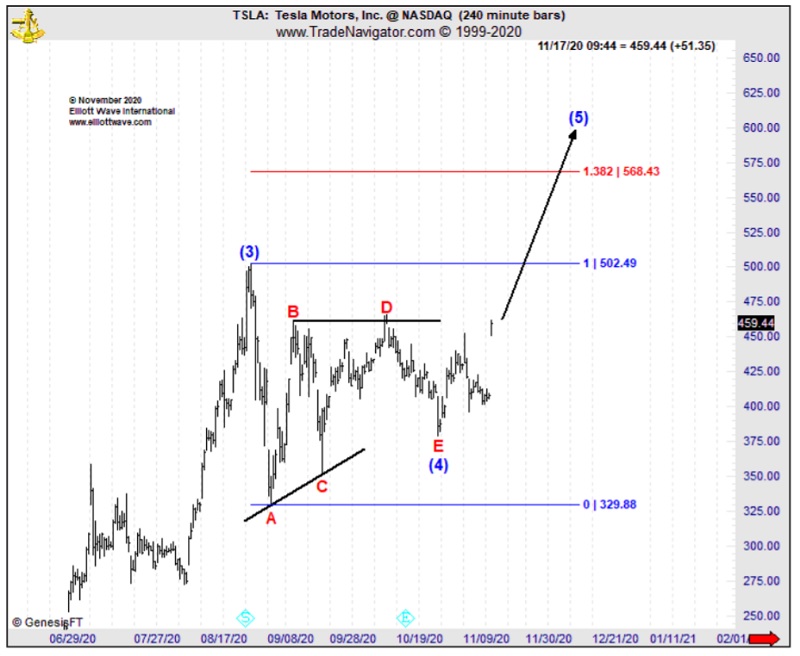
From there, TSLA took to the upside with gusto, soaring to the $600 level by month’s end. Then in the December 2 Trader’s Classroom, Jeffrey revisited Tesla’s stock with a two-part outlook for the long-term road ahead: First, higher highs into January. And then, a major bearish shift.
In Jeff’s words:
“We will indeed see prices continue to climb higher in that $700 area as we move into January. Keep in mind, bigger picture. This is a barrier triangle. Triangles precede the final move of a sequence.
“So as we do rally into January, we may be actually looking for a significant peak… that would give way to a sizable decline.”
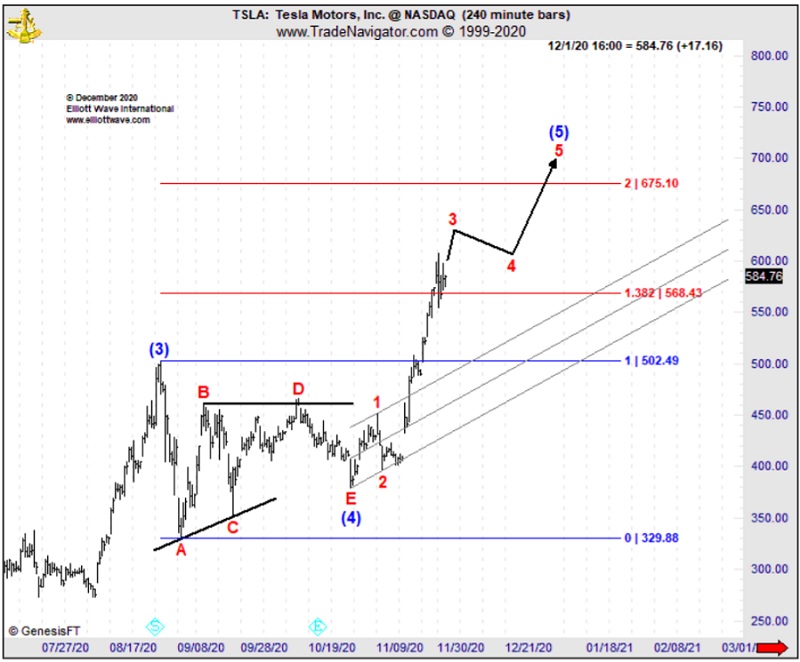
And this is what followed: TSLA fulfilled the first part of Jeffrey’s forecast and continued to rally to the $700 level and beyond, peaking above $880 per share on January 26.
And then, the stock fulfilled the second part of a “sizable decline.” TSLA plummeted 36% into early March, earning the company another “most” label … as in, the most-losing stock ever. Wrote the March 5 Fortune:
“No company in the annals of equity market shares ever dropped on a scale remotely that big in just five-and-a-half months.”
Wall Street’s finest will continue to disagree on where the world’s leading stocks are headed.
We say, let them eat debate! Because our thrice-weekly, Traders Classroom video episodes showcase those markets whose charts sport high-confident trade set-ups right here and now.
See below for more.
Self-Driving Opportunities into the World’s Leading Stocks
Imagine being shown a labeled price chart of a leading-exchange listed stock.
The chart is labeled with the preferred Elliott wave count, including critical price levels to mitigate risk.
Then, you press play and watch an expert analyst explain in comprehensive detail how to recognize the relevant Elliott wave pattern on one’s own, for future real-time opportunities.
This is every Trader’s Classroom lesson in a nutshell.
From Apple to UBER, Black Rock to Tesla, our education-meets-action Traders Classroom is where the high-confident rubber meets the road of opportunity!

Traders Classroom Real-Time Education